

Seemplicity Year in Review: Turning a Year of Security Data in Actionable Risk Insight

/ How to Measure Your Exposure Management Success
Seemplicity’s Year in Review is a product feature that provides each customer with a year-end view of how risk and exposure moved through their own environment. This post walks through the metrics included in the latest experience and what they help teams reflect on as they refine their exposure management processes.
Every year, security teams generate millions of findings across scanners, environments, and domains, which they sometimes struggle to make sense of. Seemplicity’s Year in Review was created to cut through that noise, giving customers a clear, end-of-year snapshot of how risk moved through their environment and how effectively it was reduced.
While Year in Review has been part of the Seemplicity Platform for the past two years, this year’s experience goes significantly deeper. The latest iteration introduces new usage metrics and visualizations designed to help teams better understand where their most critical risks originated, how they evolved, and where attention should be focused moving forward.
A Look Back: Operational Impact at a Glance
In previous years, the Year in Review focused on showcasing the operational value of Seemplicity, highlighting metrics such as:
- Backlog reduction, showing how raw findings were deduplicated and aggregated into actionable remediation work
- Ticket age trends, including open vs. closed tickets and average time to resolution
- Employee hours saved through Seemplicity’s automation
- Top data sources, revealing which scanners generated the highest volume of findings
These insights helped teams quantify efficiency gains and demonstrate the ROI of centralized remediation operations.
What’s New This Year: Risk, Context, and Exposure
This year’s Year in Review builds on that foundation with a sharper focus on risk context and exposure, helping security teams understand not just how much they processed, but where the most critical risks actually lived.
New insights include:
Identifying Critical Risk Hotspots
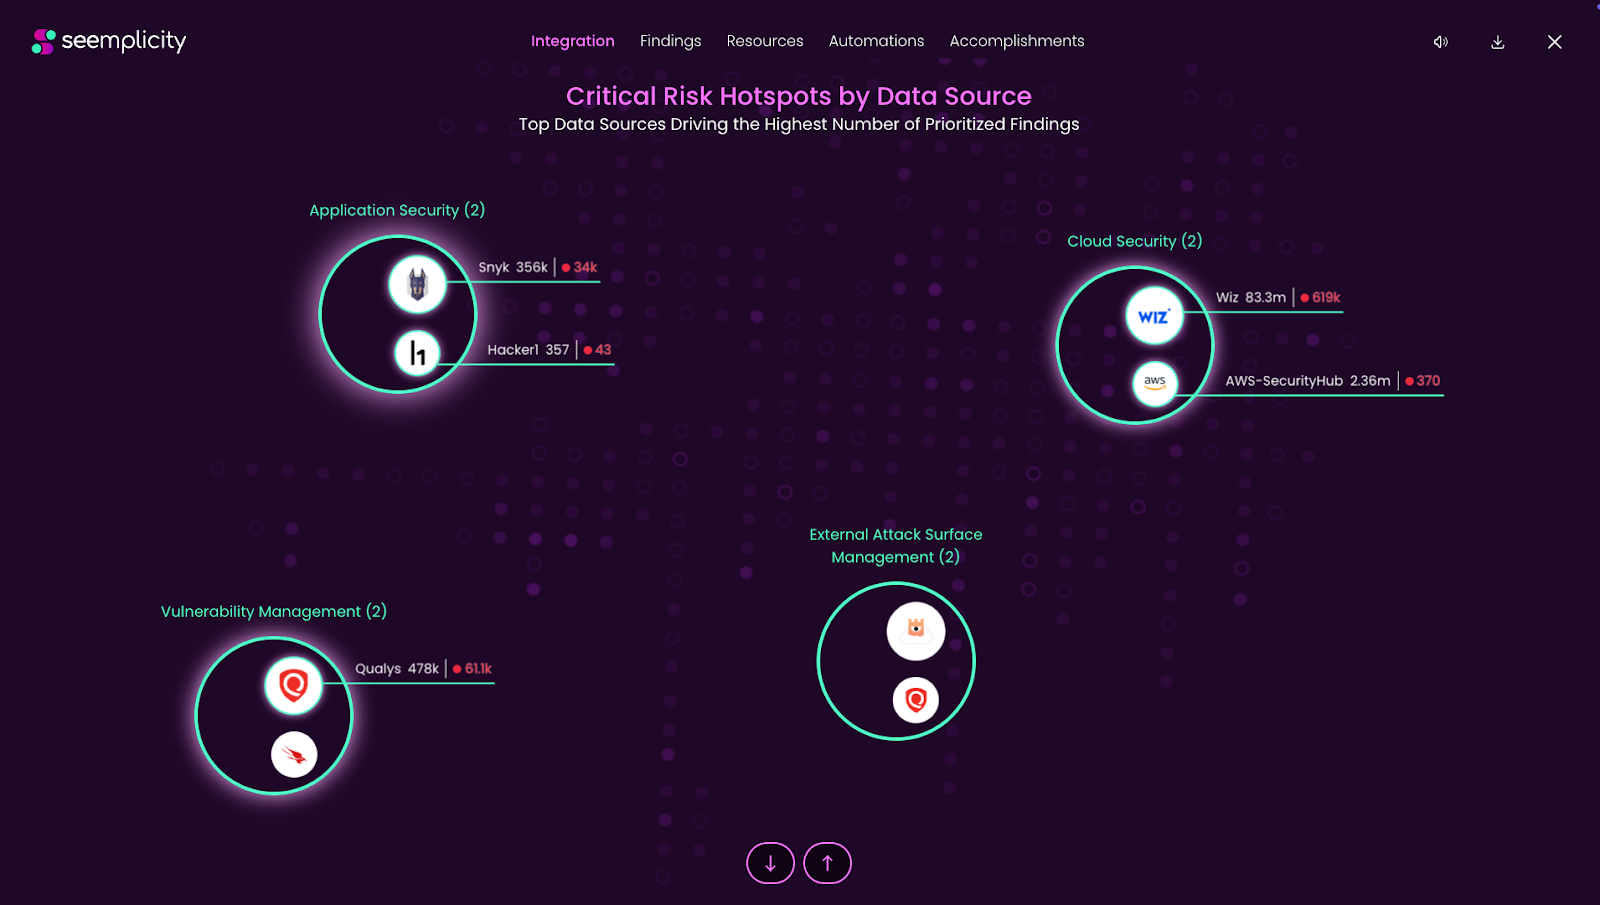
Customers can now see critical risk hotspots by data source, broken down across domains such as Application Security, Cloud Security, Vulnerability Management and External Attack Surface management (EASM). This makes it easier to pinpoint which domains and scanners contributed the highest concentration of critical findings throughout the year.
Vulnerability Severity and Exposure Breakdown
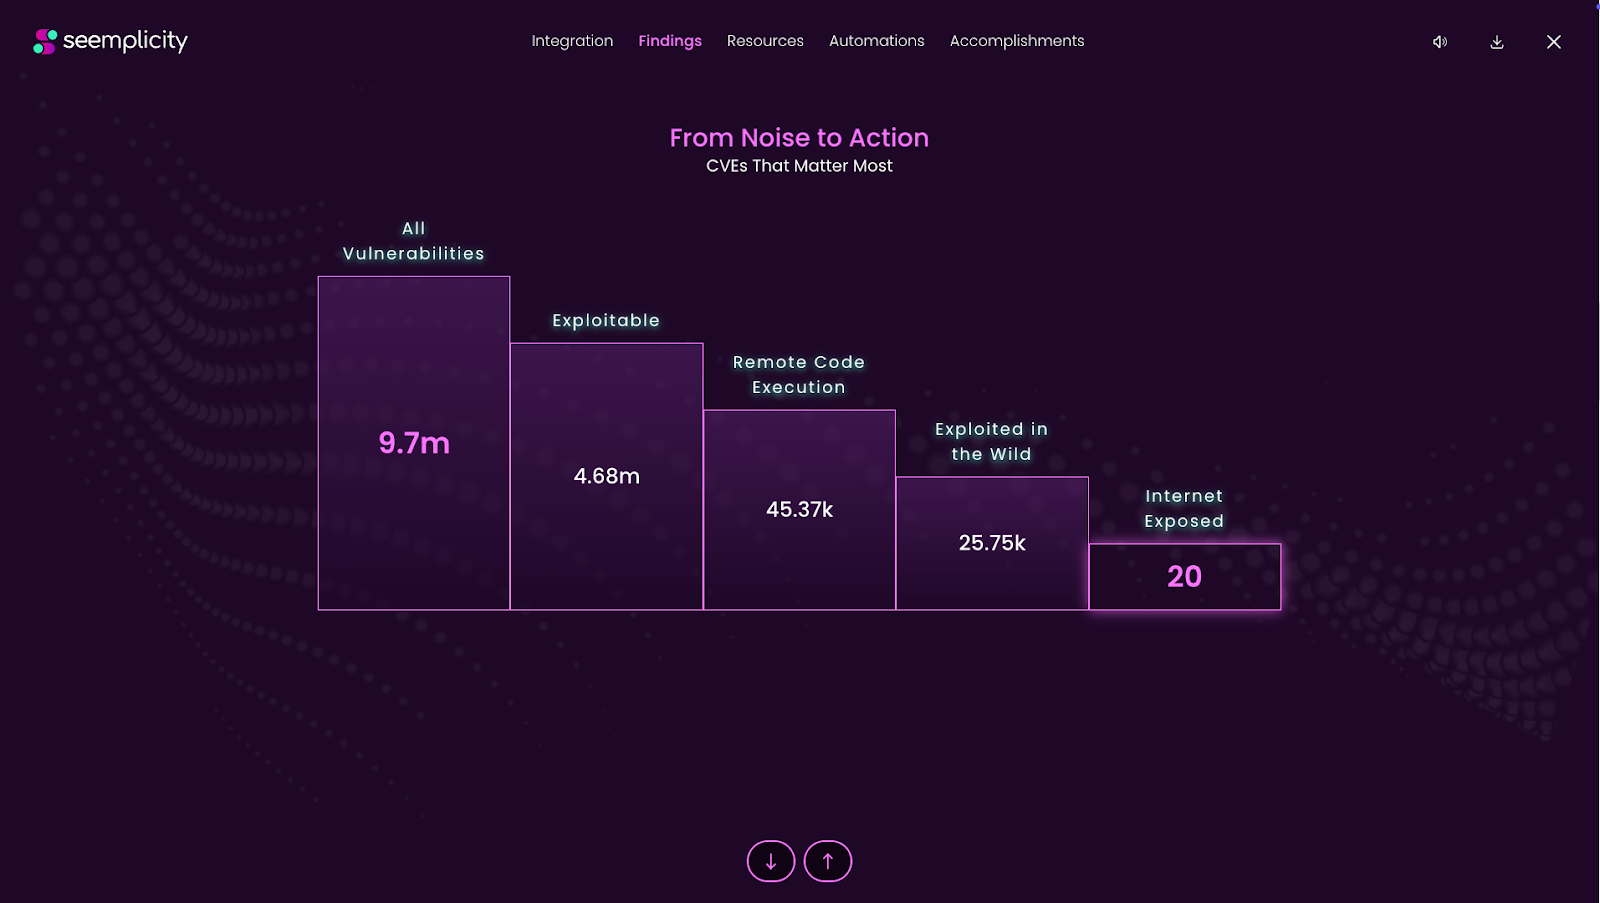
A new severity-focused visualization shows how vulnerabilities in the environment were distributed across key risk attributes, including:
- All vulnerabilities
- Exploitable vulnerabilities
- Remote Code Execution (RCE) vulnerabilities
- Exploited-in-the-Wild vulnerabilities
- Internet-exposed vulnerabilities
This view helps teams assess not just volume, but true exploitability and exposure.
Most Common Findings, Fully Contextualized
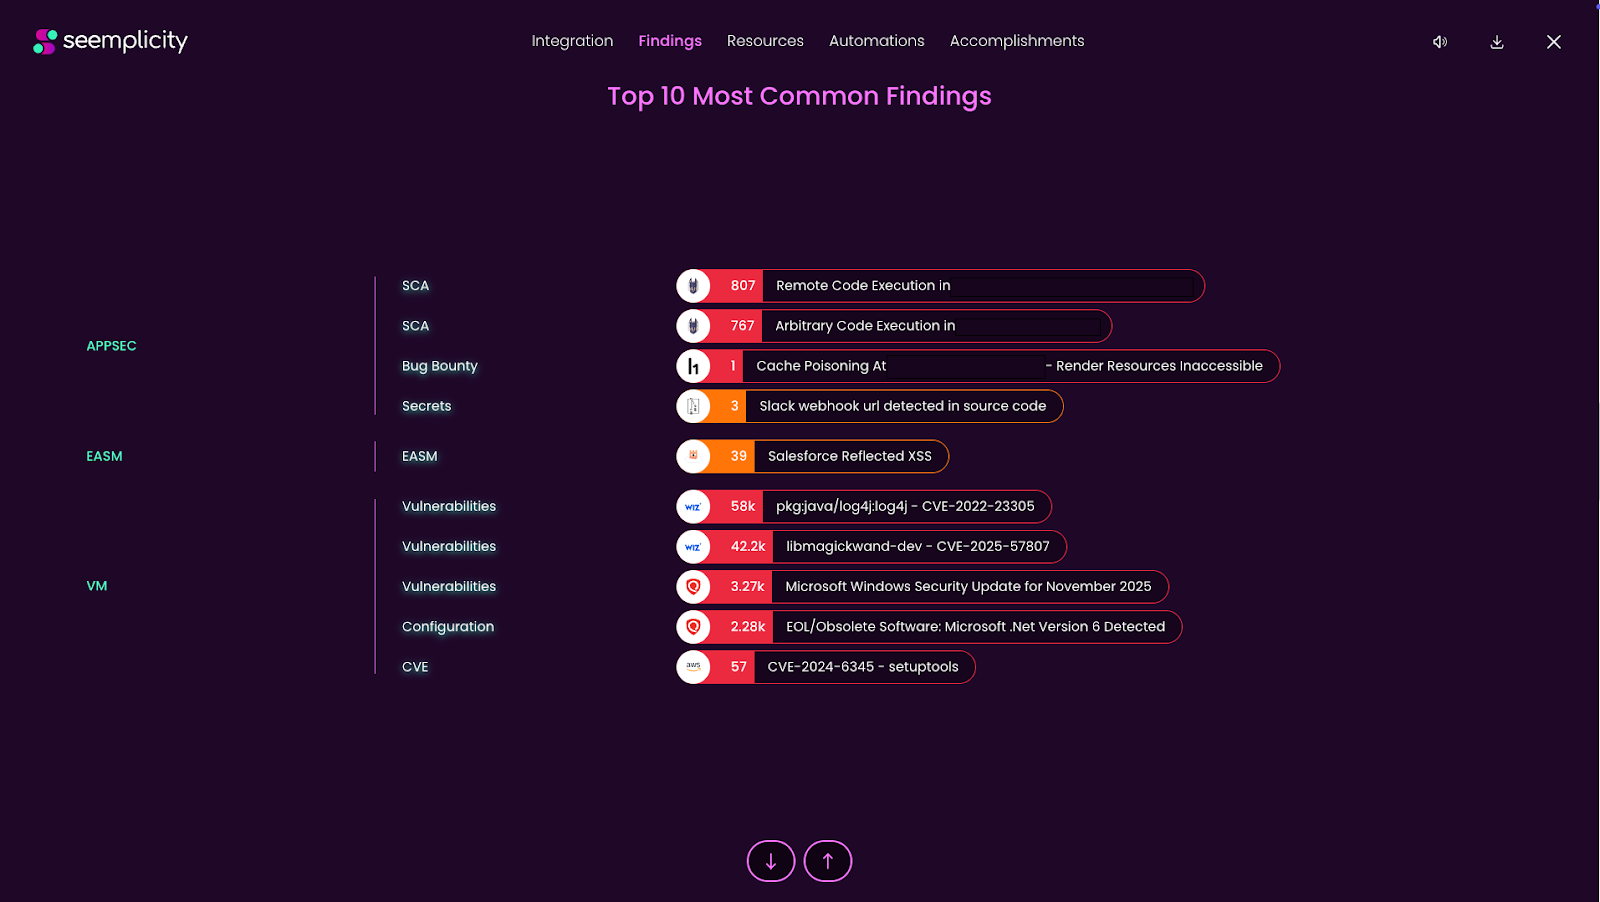
Year in Review now highlights the Top 10 Most Common Findings, categorized by:
- Security domain
- Vulnerability type
- Specific finding details
This makes recurring issues and systemic weaknesses immediately visible.
Resource-Level Risk Visibility
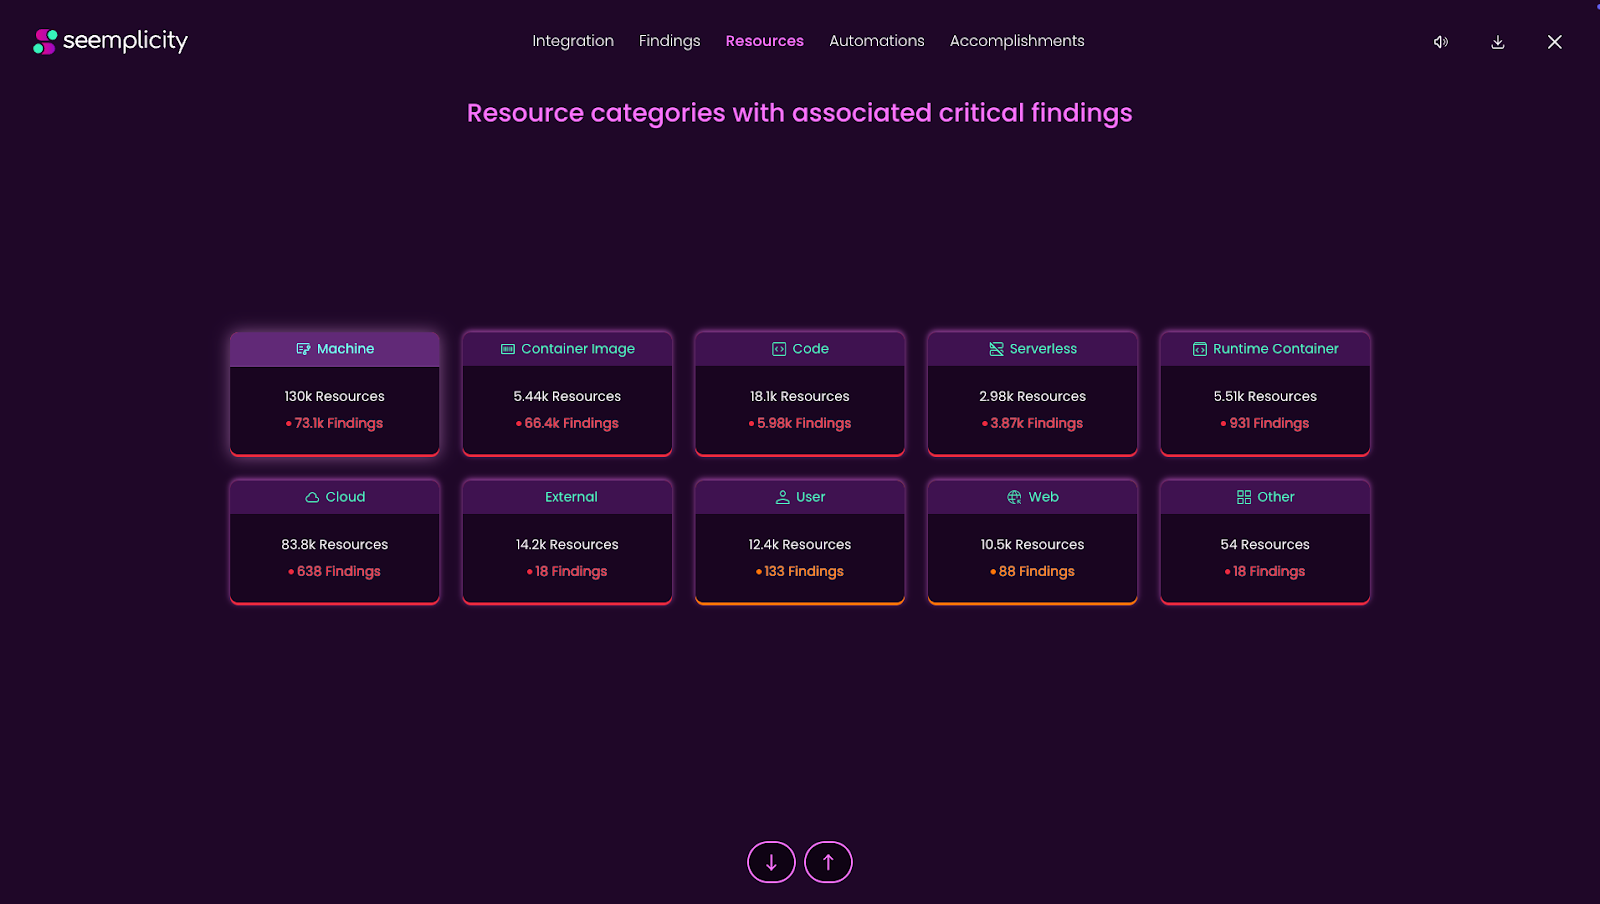
Customers can also see critical findings mapped to resource categories, including machines, container images, runtime containers, and more.
This adds another layer of clarity around where critical risk is concentrated across the organization’s technology stack.
From Individual Metrics to Industry-Wide Trends
Year in Review is intentionally customer-specific, designed to reflect each organization’s unique environment and remediation journey. For a broader perspective, an overview report covering trends and insights from the year will be released in the coming weeks, drawing on aggregated platform data to highlight how security teams are tackling risk at scale.
Turning Reflection into Momentum
The goal of Seemplicity’s Year in Review isn’t just to look back – it’s to help teams move forward with clarity. By combining operational metrics with deeper risk and exposure insights, this year’s experience equips security leaders with the context they need to refine priorities, improve collaboration, and reduce risk more effectively in the year ahead.
Stay updated on Seemplicity blog
Subscribe today to stay informed and get regular updates from Seemplicity.