Risk Dashboard
Security leaders often lack a clear, continuous view of remediation progress because data is scattered across siloed scanning tools. This manual coordination makes it difficult to track progress across the organization and demonstrate real impact to the board.
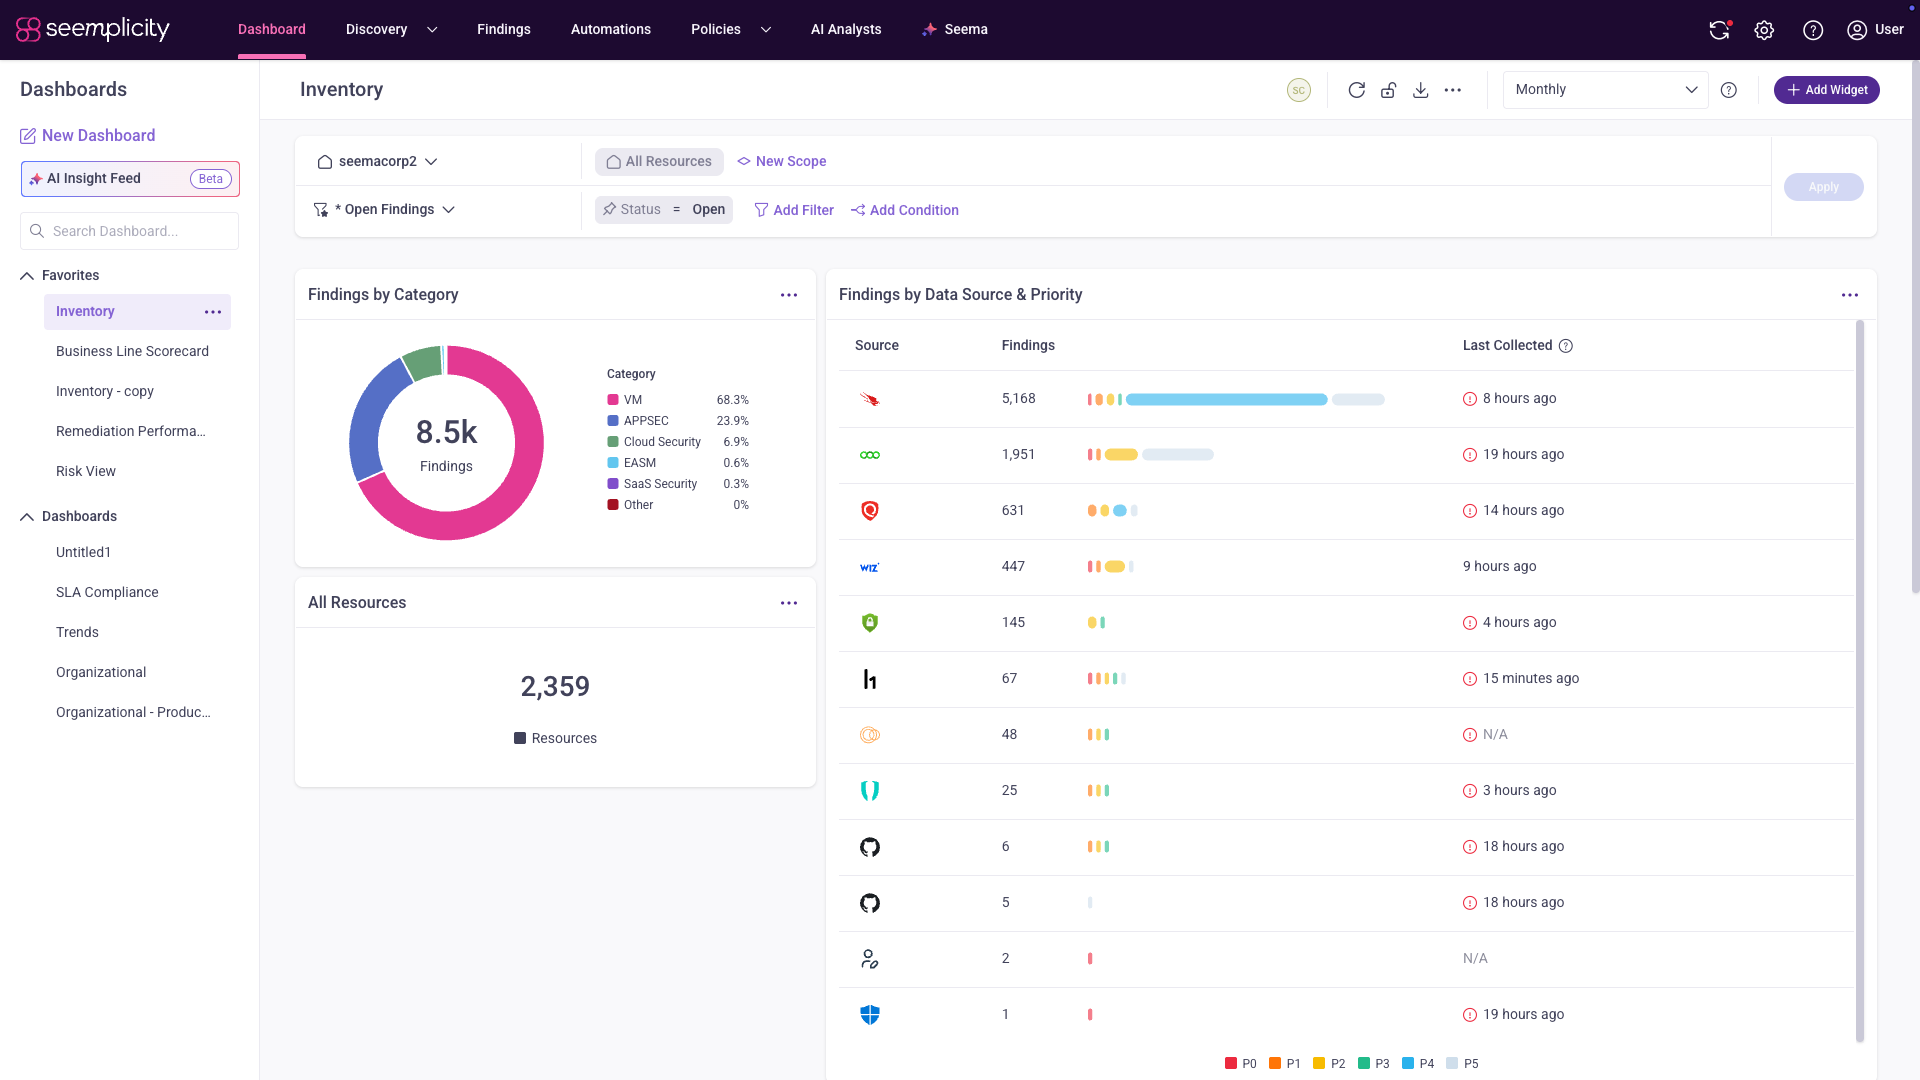
This demo features a Seemplicity Risk Dashboard, providing a single source of truth for your entire exposure management program. You will see how Seemplicity automatically ingests data from all your scanners to provide consistent metrics, highlighting how deduplication and aggregation turn overwhelming findings into a measurable burn-down rate.
What you’ll learn
Operationalize executive reporting
Learn how to replace manual data stitching with live dashboards that provide defensible evidence of progress to leadership and the board.
Prioritize for maximum impact
Discover how aggregation allows one remediation item to address multiple vulnerabilities at once, saving fixers time and effort.
Gain granular risk visibility
See how to drill down into your top security findings and most vulnerable packages to ensure your resources are focused on what matters most.
Key Features
Unified Metrics
View consistent risk metrics across cloud, infrastructure, and application scanners without the need to open every individual tool.
SLA Tracking
Monitor current SLA status at a glance to ensure technical teams stay on top of critical remediation timelines.
Burn-down Views
Track your vulnerability burn-down rate over time to visualize risk reduction and prove the effectiveness of your security investments.
Finding Aging
Identify the average age of findings to pinpoint bottlenecks in the remediation cycle and accelerate the path to resolution.