Inventory Risk Dashboards Built for Your Organization
Understanding risk across a modern environment means knowing not just how many findings you have, but where they are coming from, what assets they affect, and which ones are the most severe. Without a consolidated view, security and engineering leaders are left piecing together data from multiple tools, building manual reports, and making prioritization decisions without the full picture in front of them.
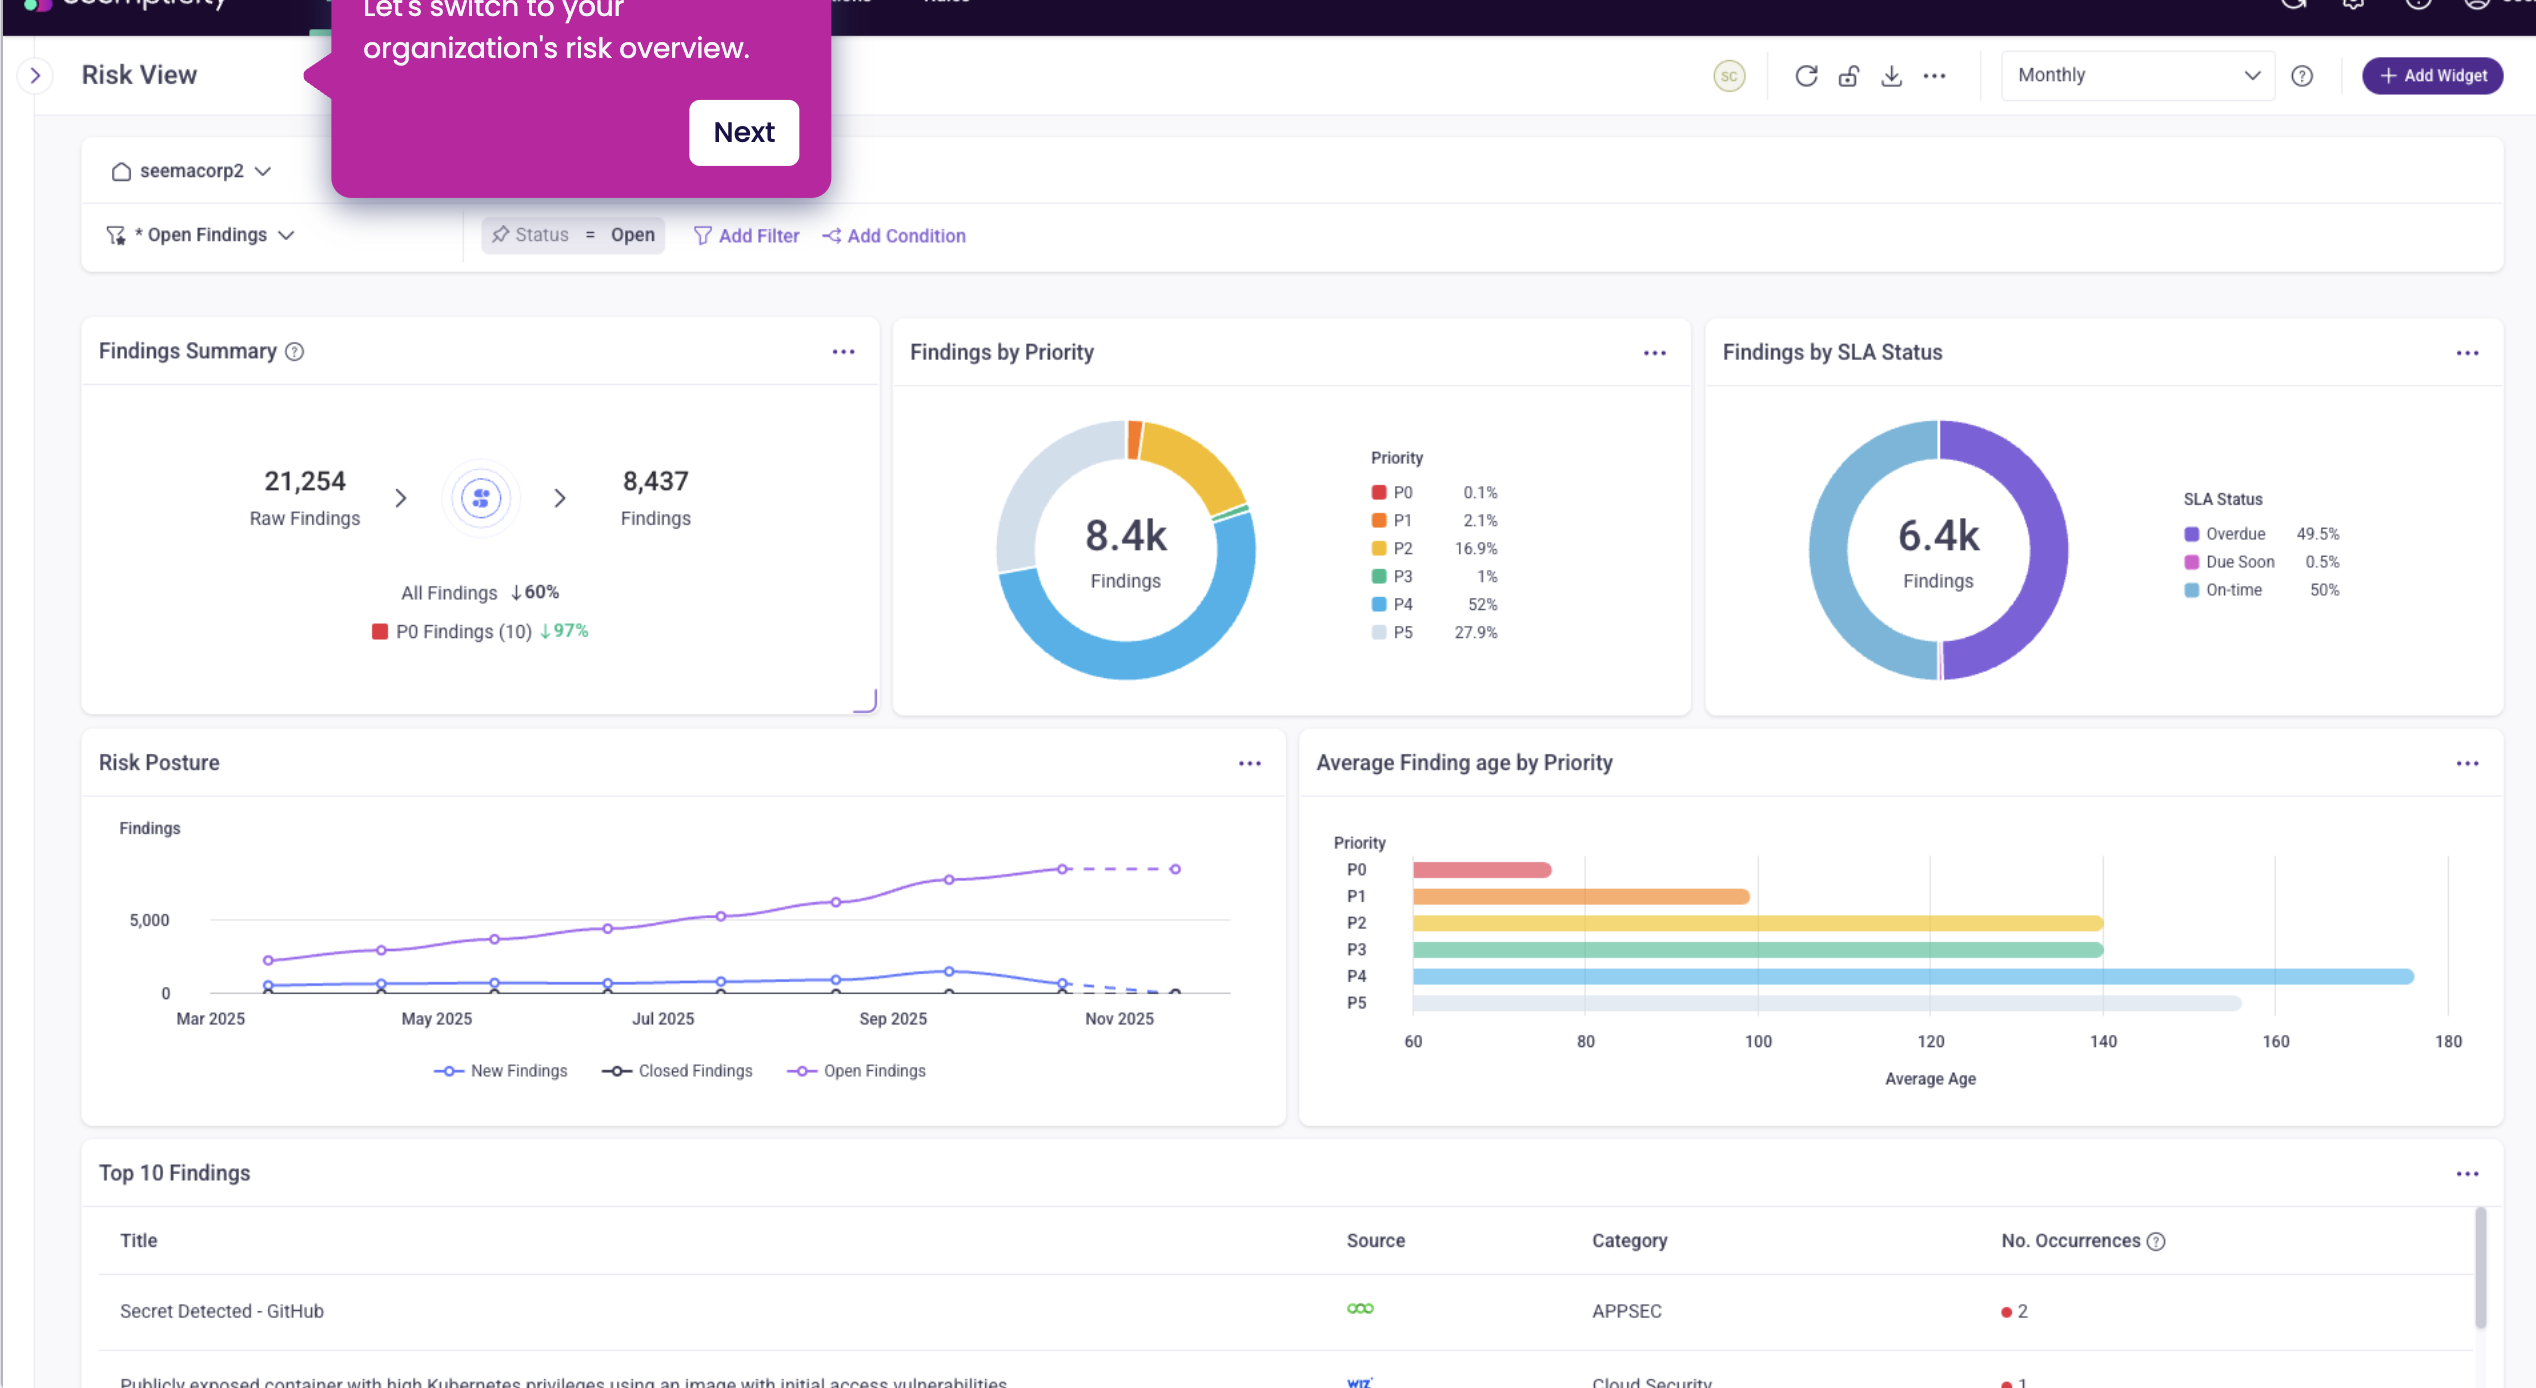
This demo walks through an Inventory Risk Dashboard built in Seemplicity to provide an at-a-glance view of risk across the entire organization. You will see how to quickly assess finding volume and severity by source tool, track the number of cloud and code resources being monitored, and identify the repositories carrying the highest concentration of risk. Because every organization tracks different metrics, the dashboard is fully customizable, and can be built to reflect what your team actually needs to see.
What you’ll learn
Understand Where Your Findings Are Coming From
See how the dashboard breaks down finding volume and severity by source tool, giving you an immediate read on which scanners are generating the most noise and where your most critical issues are concentrated.
Track the Assets Behind the Risk
Learn how Seemplicity surfaces the full count of resources being monitored so you always know the scope of your inventory and can contextualize findings against the assets that matter most.
Identify Your Highest-Risk Repositories at a Glance
Discover how the top vulnerable code repositories view surfaces which repos carry the greatest risk, complete with severity breakdowns, so AppSec and engineering teams know exactly where to focus their attention first.
Key Features
Findings Breakdown by Source Tool
Instantly see how many findings each tool is contributing and what their severity distribution looks like.
Unified Inventory Tracking
Monitor the total number of resources in your environment
Top Vulnerable Repository View
Surface the code repositories with the highest concentration of findings, paired with volume and severity breakdowns.
Fully Customizable Dashboards
Every organization tracks different metrics. Seemplicity’s dashboards are built to be tailored to risk signals that are most meaningful to your program.